Adding “Ride Length” to Our Sheets
The first new column that we will add onto our sheets is meant to show the amount of time that each individual ride lasted for. We will call it “ride_length”, keeping with the naming convention found in the other columns.
Specifically, we will continue to use an underscore to replace spaces in the titles of our columns. This will make it easier to use these column titles once we start our work in the R program.
In order to get the ride length for each row, we will need to start at the first row and enter a simple Excel function. We will subtract the end time (found in the D column as “ended_at”) from the start time (found in the C column as “started_at”).
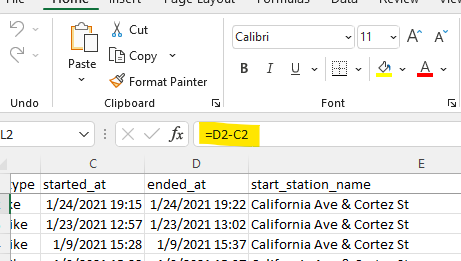
When we do this for the first row, we end up with a decimal point value, rather than a value of time.
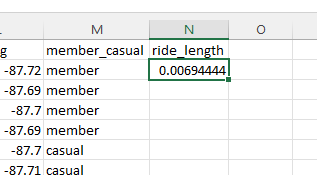
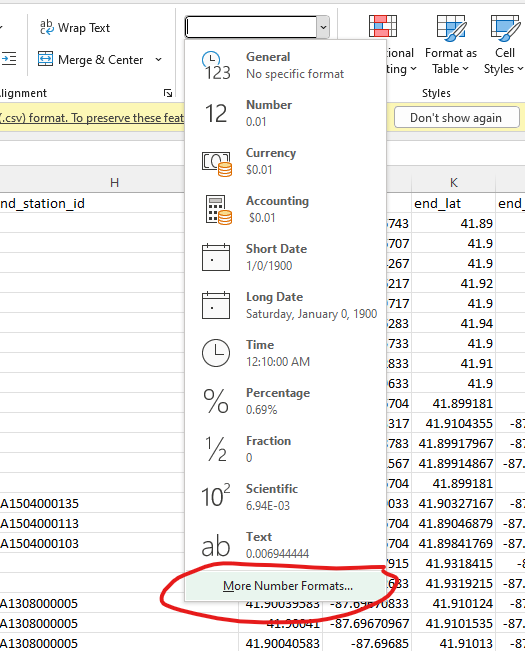
This will not do. We’re going to need to change the our value into a time format which will show how much time has passed during the trip. To do this, we are going to go to the format section of our Excel menu while the cell is still selected. From there, we’ll click “More Number Formats”.
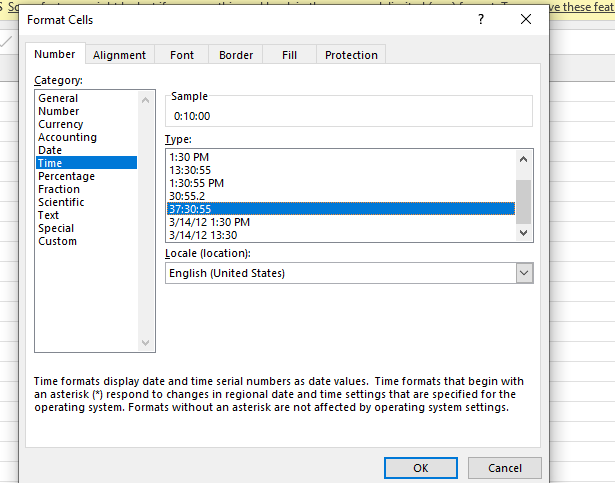
Once the Number Format page is open, we will select the “Time” option from the side panel. The main panel will list a set of time formats that we can choose from. We are going to choose the format that shows the hours, minutes, and seconds of a value. It will be in the format of “hh:mm:ss”, with each letter representing each of the prior measurements of time respectively. With that format selected, we will click “Ok”. Before we click “Ok” and close out that window, it should looks something like this:
When we look back to our “ride_length” column, there should be be a value within that first cell that is in our selected format. Now, all we need to do is double click the small square at the corner of the cell. This applies the function that we used earlier across the entire column.
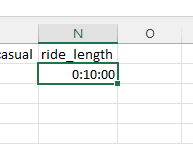
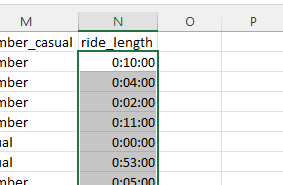
With the “ride_length” column completed in this first spreadsheet, we will need to save our results to a new folder that we will call “Edited Data V1 CSV”. The name of this file for January will be “2021-01-tripdata.csv”. Once this first spreadsheet is saved, the last thing we will need to do for this column is to repeat all of the previous steps into each file until all 12 months have a “ride_length” column added to them.
By the end of this process, all of our monthly datasets should have a new “ride_length” column added to them. In the next posts, we will continue to add more columns to our datasets. In order to do that, we will need to use the R programming language.