The “Analysis” Phase: Setting Up a SQL Server Database
Now that we have a made the desired edits to our raw dataset and have created new spreadsheets that display our changes, it is time to analyze our data. This is the crux of project. During our “Analysis” phase, we will use our data to develop the key insights which will help us answer the question driving this whole project: How do causal riders use the service differently from members?
One of the most useful tools that a Data Analyst can use to sort through a vast dataset is a language called SQL, which stands for Structured Query Language. The “queries” made in SQL help to answer questions an analyst might have regarding specific details and aspects found within a dataset. We will get a better idea of what kind of answers our queries can provide as we continue through this phase of the project.
We will need a SQL server to run queries on this massive dataset that we have compiled. For the purposes of this project, we will assume that the company, Cyclistic, uses Microsoft SQL Server for it’s analysis. Thus, we will be using the T-SQL language to go over data, though the steps we will be taking in SQL Server should not be much different in other versions of the SQL language.
Here is a tutorial on how to install Microsoft SQL Server:
Once we are finished with it’s installation, the first step in SQL Server is to create a new database that we will use for our analysis. We can do this by writing a query. With your SQL Server Management Studio open, click the “New Query” button at the left corner of the menu
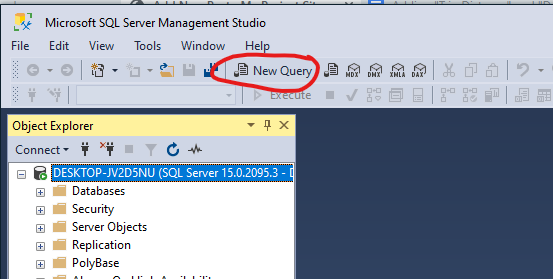
We’ll make a new database for our analysis and call it “CyclisticTripData2021”. Note that the name has to be all together, with no spaces. This is just way that we can help SQL Server to not confuse the individual words in the database title with separate elements that can make up SQL code.
To make our new database, type in:
CREATE DATABASE CyclisticTripData2021 ;
We can select this query and press the “Execute” button, which is right underneath “New Query”. Once we have executed this line of code, there will be a new database located in the “Databases” folder in our “Object Explorer” panel.
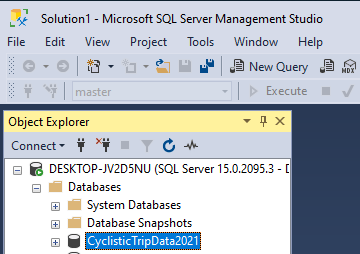
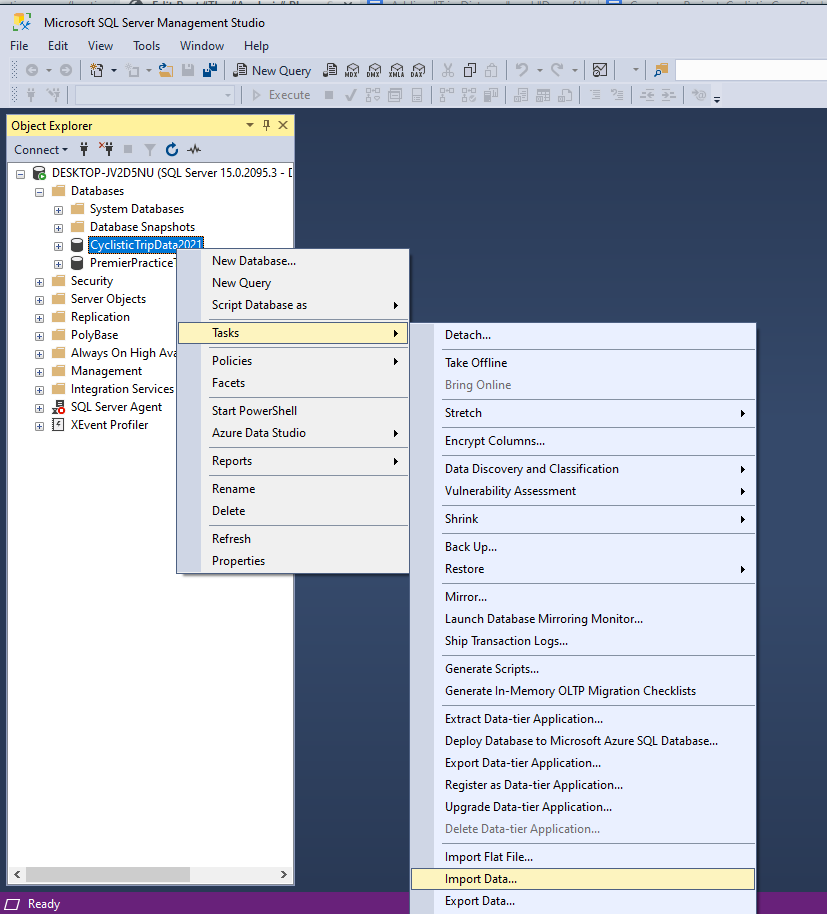
From here, the next thing to do is upload our data into tables for this database. We will use the Import Wizard to make this easier. Simply right click on your database name in the Object Explorer to bring up the dropdown menu. Hover over “Tasks” to expand the menu, then select “Import Data”. This will bring up a window called the “SQL Server Import and Export Wizard”:
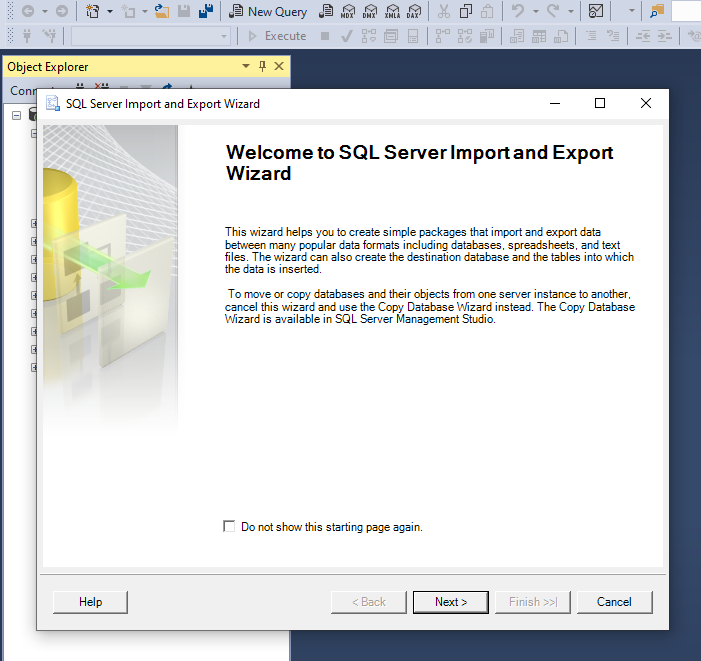
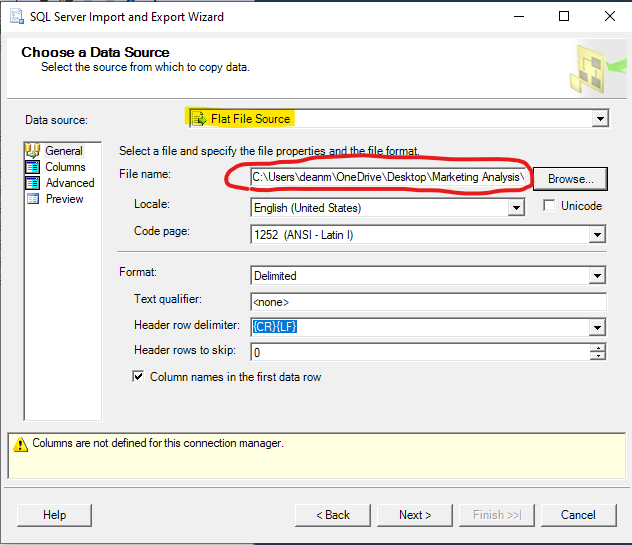
Once the Import Wizard is open, click “Next” to bring up the “Choose Data Source” page. In this page, open up the dropdown menu for “File Source” and scroll through the options until you are able to select “Flat File Source”.
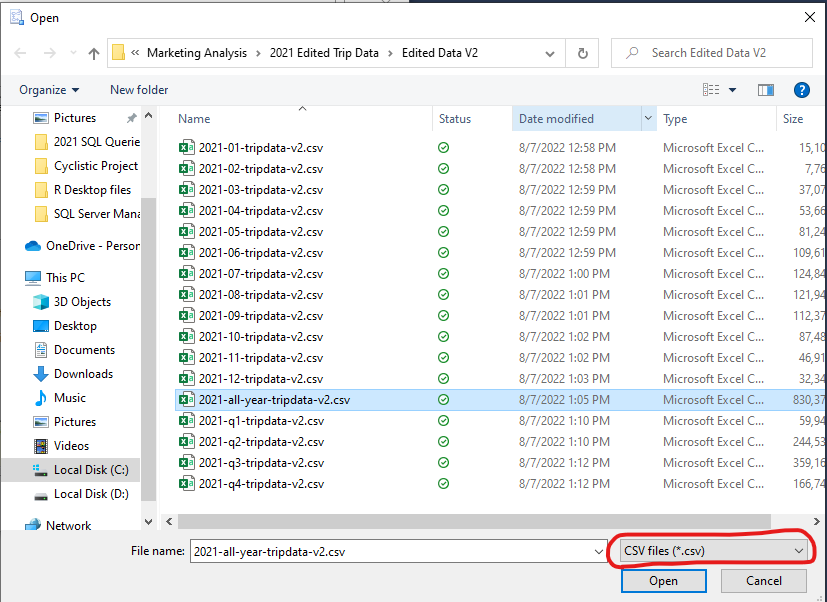
With Flat File Source selected, more options will appear in the window. Click the “Browse” button to open up a new window where you will select the file that you wish to import. Navigate through our Marketing Analysis folder until you are able to find “all-year-2021-tripdata-v2.csv”. Remember to change the file type to “CSV file” in the search window, otherwise our files won’t appear. With our dataset selected, the Choose Data Source window should look like this:
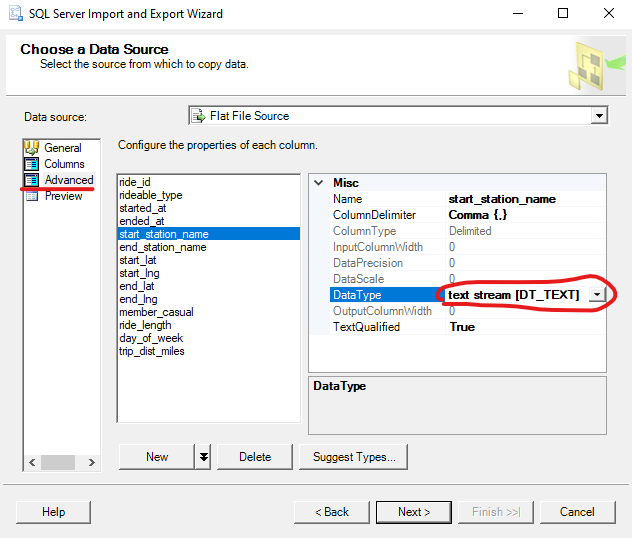
Before we can move on from this window, we will need to make sure our data is formatted in a way that the Import Wizard will accept. Click on the “Advanced” button on the side panel of the window. This will bring up a new menu where you can review each column in the dataset and choose the data type that you wish to import them as.
By default, all of the columns will be set as “string [DT_STR]” for their DataType. For most of the columns this will work best, because the Import Wizard has no issue with reading data as strings. The only thing about this particular DataType option is that it is limited to a certain amount of characters. Our “start_station_name” and “end_station_name” columns can sometimes go over the character limit.
We are going to want to change both of their DataType options to “text stream [DT_TEXT]”. This DataType has no limit and will help the Import Wizard to accept the data for these to columns. You are going to want to make sure that both the “start_station_name” and “end_station_name” columns have their options set like this:
By doing this, we are able to ensure that the Import Wizard will accept our data. Later on, we will make changes to the imported dataset in order to help our analysis. The dataset should be ready to import now, but we have the option at this point to change the DataType of a few more columns.
We can choose to change the DataType of the columns which have purely numbers in their data. This should make things easier later on when we make alterations to the imported dataset.
The columns we want to change are the four columns with our coordinates, as well as the column with our Trip Distance data. Those columns are namely: “start_lat”, “start_lng”, “end_lat”, end_lng” , and “trip_dist_miles”. We will want to change all of their DataType to “float [DT_R4]”.
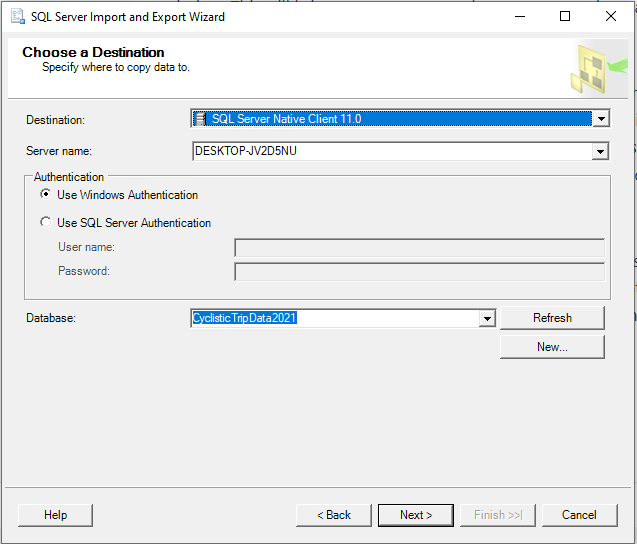
With all of these changes in the Advanced panel made, we can go back into the General panel and then click next. This should bring us into the “Choose Destination” page. From here, simply open up the dropdown menu next to “Destination” and select the option for “SQL Server Native Client”. The rest of the page should automatically fill with the name of our database:
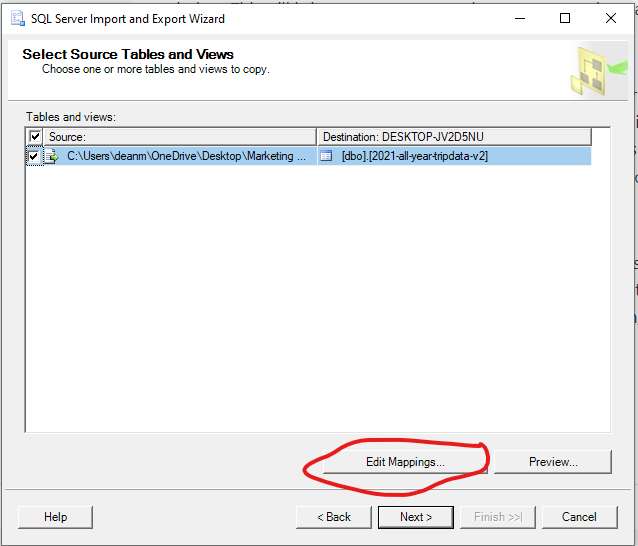
When we click Next again, it brings us to a page called “Select Source Tables and Views”. Here we can see that the file location that we will be importing the data from is displayed on the left of the window, under the Source tab. Right next to it is the Destination tab, which should read “[dbo].[2021-all-year-tripdata-v2]”. The “[dbo]” portion stands for Database Object, and indicates that we will be making a table in our database. The portion following it in brackets is the name of our table of data. The Import Wizard automatically takes the name of the file and makes it the name of the table. We can leave everything on this page as it is.
Before we move on, it would be wise to check that our data is being imported into the datatypes that we mean for them to be. We can click “Edit Mappings” to see how each column is formatted, and if we need to make any changes.
This will open the “Column Mappings” window. Scroll down to the columns that we altered and briefly check to see that they have the desired alterations for this stage of our import. The mapping should look something like this:
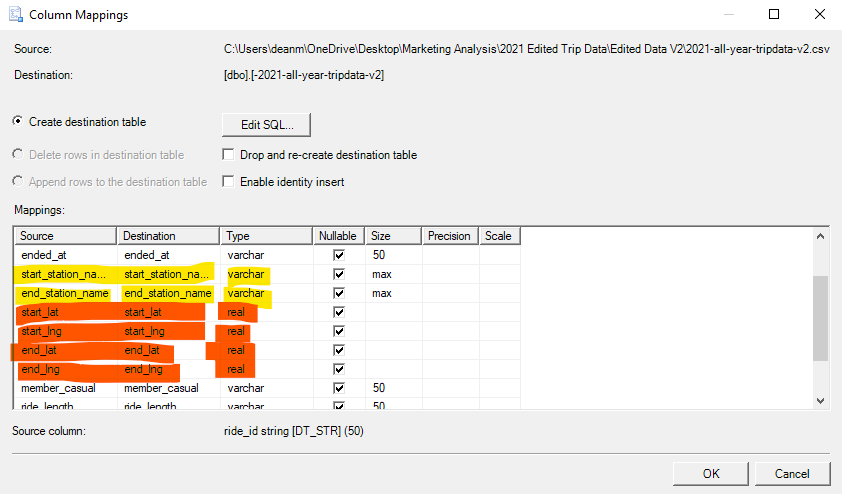
Once we have checked to make sure our columns are mapped the way that we want (to the limit that the Import Wizard can handle), we can continue on with the import process. Click the Next button until you get to the “Finish” button. Go ahead and click Finish. This will bring us to the final page of the Wizard called “Performing Operation”. Here the Wizard will take several moments to actually the work of importing our data. The final result should look like this:
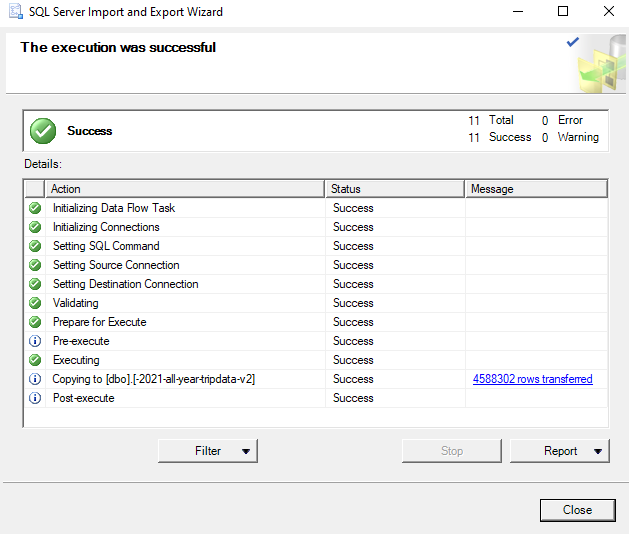
If you get an error message on the Performing Operation page, it means that one of the columns has a DataType setting that the Import Wizard could not work with. It will require trial and error tinkering with the settings to fix this (I’ve learned from experience!), but for this dataset we already know that the only major hurtle here is the two “station name” columns. If you implement the changes listed above just for those two columns, the data should make it through the Wizard.
Simply exit out of the Import Wizard from here and go back to our CyclisticTripData2021 database. Open up the tables folder in the database and check to see that our new table is there.
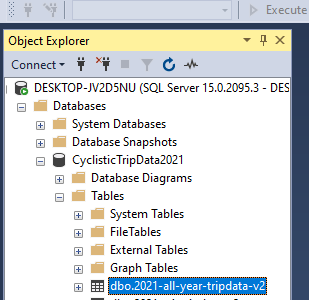
Congrats! You’ve imported a working version of the dataset into SQL Server. This helps set the stage for our analysis phase, but there is still some more prep work to do before diving in. In the next post, we will further edit the datatypes of our columns using a new SQL query.