The “Prepare” Phase
The next phase of the analysis is to prepare the data that will be used. Some important things to determine when conducting such analysis are the credibility of the data and if it is used under proper license.
In reality, this is publicly available data collected by Motivate International, which Coursera compiled for the purposes of this project. For the sake of this scenario, we will say that this is raw data which was provided to us by Cyclistic’s IT Department.
The Goal: Determine how casual riders use Cyclistic bicycle services differently than riders with an annual membership.
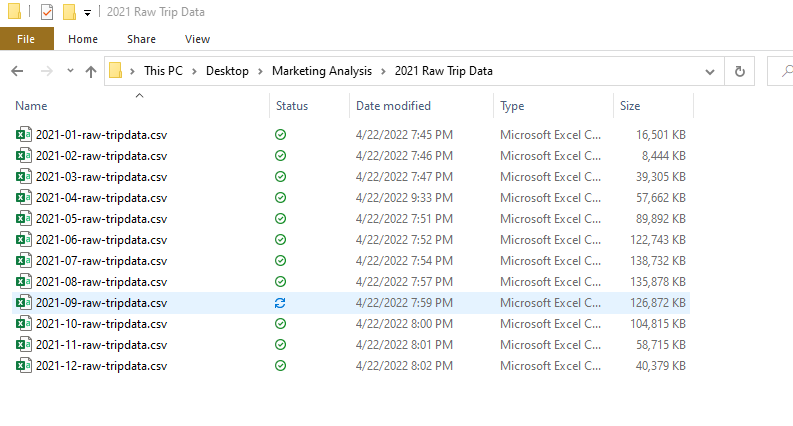
The Data: We used data collected by the company on each ride that was taken for the year of 2021. This raw data was stored on a web page built specifically to house it. Since this data is all in-house, it can be considered a primary source and is credible to use. This data was compiled into spreadsheets for each month of the year, with titles like “202104-divvy-tripdata.zip” assigned to them. I unzipped the files and placed them into a folder named “2021 Raw Trip Data”, located within a main folder on my desktop named “Marketing Analysis”. Next, I renamed all the files using the format “2021-04-raw-tripdata.csv” to make the dates more legible. We will keep all of our raw spreadsheets in this folder, and place an edited version of each sheet into a folder we will call “2021 Edited Trip Data.” The edited files will all be converted into CSV files that we will use with Excel, in order to avoid conflicts down the road when uploading datasets from the R program.
*Note: I encountered problems working with Excel sheets using R programing in a later part of the project, so we will instead do our work using CSV format on our files. The Excel Workbook files will still be kept in the project folder, in case someone else would like to work with them.

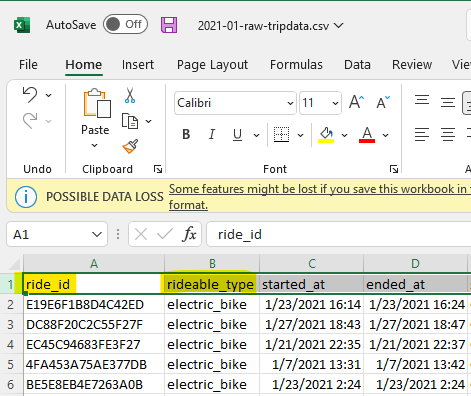
Opening up the file for January, we can see the different columns that this data is divided up into. The “ride_id” column lists the unique id assigned to each ride. The “rideable_type” column shows what kind of bicycle they used.

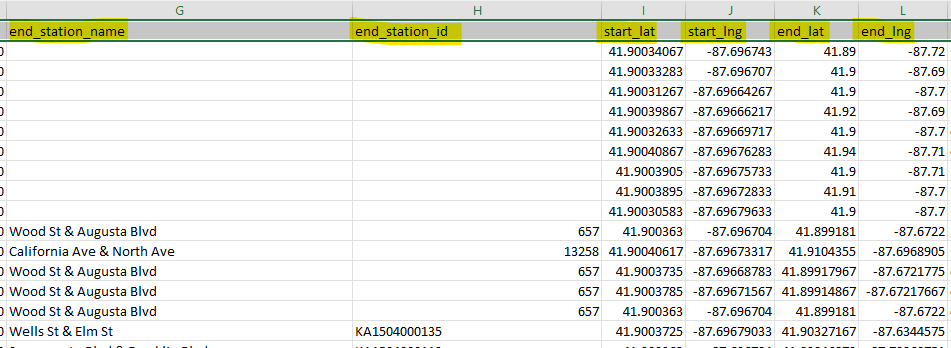
There are columns for the time that each ride began and when it ended, as well as locational data regarding where the ride began and where the bike was dropped off. This locational data consists of the name of the stations where the bikes were picked up and dropped off, as well as the stations’ id and longitude and latitude coordinates.

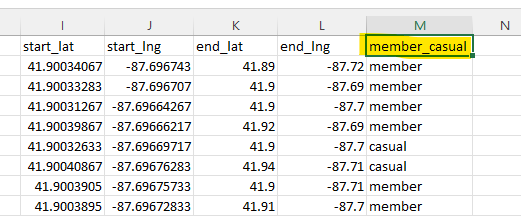
The last column offers data crucial to our analysis, with “member_causal” showing whether the rider was a casual customer or an annual member.

All this data put together offers enough material from which to build an analysis of the different ways these customers use our bikes.