Using SQL to Gain More Insight From Our Dataset
So far in our Analysis Phase, we have used SQL queries to accomplish many necessary tasks. We’ve created a database in SQL Server, imported a table, altered datatype for the table’s columns, learned to use SELECT FROM WHERE queries, and used that knowledge to create new tables from the original.
It’s time to use our knowledge to start answering some questions that we have about our dataset. We can run queries to find out basic things about our data for the year 2021. For instance, if we want to see how data on members looks without view data on casual riders, we can run this query:
USE CyclisticTripData2021;
SELECT *
FROM dbo.[2021-all-year-tripdata-v2]
WHERE member_casual =‘member’ ;
This pulls up all of the data from each row that has the value “member” in it’s member_casual column. We can inject a COUNT statement right after SELECT in order to get the count of total member rides throughout the year. The COUNT statement gives us the count of a given criteria by nesting it inside of the statement. To get the total count of members throughout the year, we will use this query:
USE CyclisticTripData2021;
SELECT COUNT(*) AS MemberTotal
FROM dbo.[2021-all-year-tripdata-v2]
WHERE member_casual =‘member’ ;
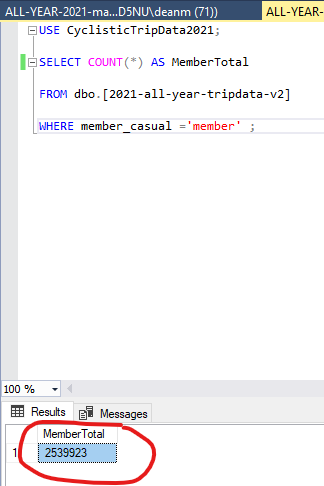
Notice that there is an AS statement following COUNT. The AS statement is used to create a column name for the resulting query, as it will only pull up the number count for out total number of member rides. This is the result of our query:

We should create save files for each of these queries. These will be used later to export them into CSV files. We are going to want to do this for all of our queries moving forward. It would be a good idea to replicate both of these queries, replacing “member” with “casual”. Be sure to save both of those queries as well.
Another question that arises when looking over our data comes from our ride_length column. Specifically, how does are data look over certain periods of time? We may wonder what our data looks like for all rides that fall within 1 hour. We can write this query to find out:
USE CyclisticTripData2021;
SELECT *
FROM dbo.[2021-all-year-tripdata-v2]
WHERE ride_length <= ’01:00:00′ ;
We should save this query and also do one for all the rides that go over an hour. And what about 2 hours? Or 8 hours? We can do the same thing for these time values just by swapping them out in our queries. Again, save the results of all of these.
By now, we have gotten the hang of writing SELECT FROM WHERE queries to answer questions within their parameters. We should export the queries that we have so far into a subfolder in our Marketing Analysis folder. We will name this folder “2021 SQL Queries” and place a CSV file for all of our queries inside of it.
The Import and Export Wizard can be used to do this task. Start by opening up the Wizard, just like we did to import data into our database. Right-click on CyclisticTripData2021, click Tasks, and then click Export data. The window for the Wizard will open up. Click Next to go to the Data Source page.
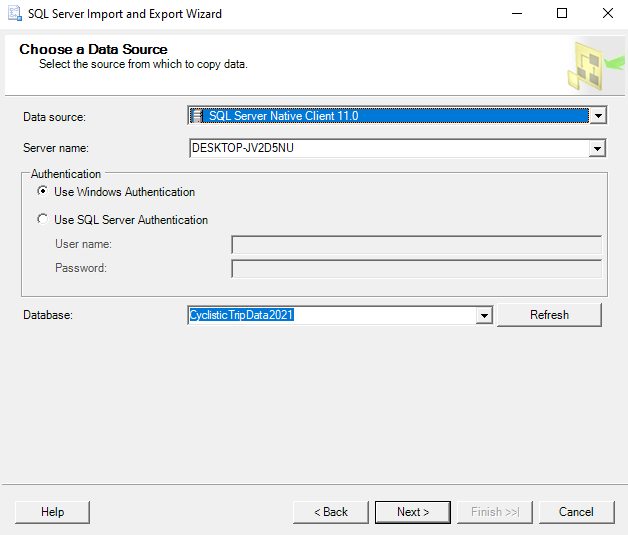
In the Data Source field, open the dropdown menu and select “SQL Server Native Client”, all the way at the bottom. This will automatically fill in the rest of the page, including the database field (which should be CyclisticTripData2021).

Click Next to move on to the Destination page. In the Destination field, click the dropdown menu and select Flat File Destination. The page will open up some more criteria to fill. Click the Browse button to find our new subfolder in Marketing Analysis, called “2021 SQL Queries”. Select this folder and type in the name you wish to call this file. If we are saving our new “over 1 hour” query as a CSV, be sure to click the CSV option in the corner of the window and type into the field “all-year-2021-tripdata-over-1hr”. Click Open in that window to return to the Export Wizard Window. Click Next from there.
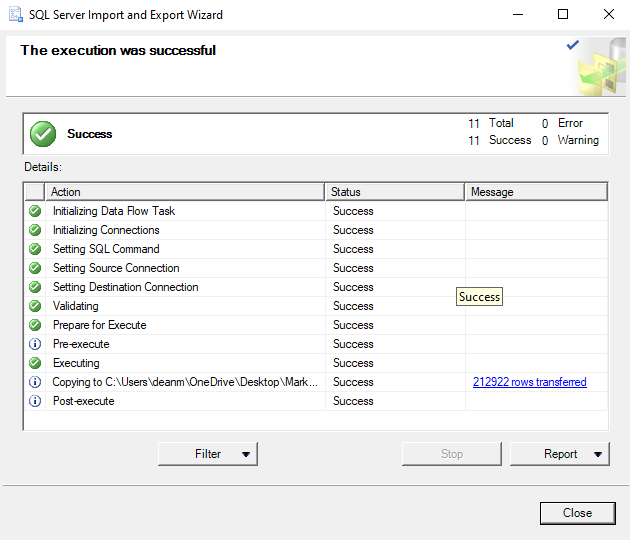
This should bring you to a page called “Specify Table Copy or Query”. From here, make sure to select the option that says “write query to specify the data to transfer” and the click Next. There will be an empty text panel in the next page. Copy your query from the file you wish to export and then paste it into the text panel in the Wizard. From there keep clicking next until you reach the Finish button at the end. Clicking the Finish button will run the Export Wizard. This should be the last page that you see when everything is complete:

We are going to save every query that we want to study further as a CSV file. Every query whose information we think might make for an interesting graph should definitely be saved. The queries that have simple, once cell results can be saved as well. Or we can just make a note of those results and record them somewhere else in the future (like a spreadsheet that will hold the results of several of these smaller queries).
The SQL queries that we have written so far have been able to find basic number counts and also create new sunsets of data. If we want to write a query to find things like mean, max, and mode, then we will need to write queries that are slightly more complex. In the next post, we will go over techniques that we can use to extract such data from our dataset.